Author: Dr Kuntal Goswami (FIPA), The Principal Accountant & Sustainability Specialist at Accounting & Business Care. Founder & Researcher at Australian Centre for Sustainable Development Research & Innovation, MBA Academic
Investment & Sustainable Business Outlook Article: 2 Issue:1 Volume: 1 2026 ISSN: 2982-3226 (Print) ISSN: 2982-3234 (Online) www.accountingbusinesscare.com.au
Abstract: The future is uncertain and insecure; however, we must be hopeful for our future and must be prudent financial planners to maintain or improve our quality of life in future. The Australian Securities Exchange (ASX)-listed Exchange Traded Funds (ETFs) are relatively safer investment products that help preserve the purchasing power of our capital and drive the growth of our savings for future economic prosperity. Exchange Traded Funds (ETFs) are inherently diversified financial products with investment exposure to different asset classes, geographical markets, sectors, and investment strategies to minimize risk and maximize returns.
This article has mapped and analyzed, on average, 340+ ASX-listed ETFs across 19 ETF clusters between 2024 and 2025. A comprehensive analysis of all ETF clusters showed that, on average, ASX-listed ETFs provide 3.35% annual distribution (dividends & interest earnings), with a weighted-average 1-year total return of 27% and weighted-average 3 to 5 year total returns of 14.50% to 9.32%, respectively. In addition, the ETF market had experienced 17.28% capital
Key words: Australian Securities Exchange (ASX), Exchange Traded Funds (ETFs), Investment strategy, Portfolio diversification
Citation: ami, K. (2026) ‘Mapping Exchange Traded Funds (ETFs) listed on the Australian Securities Exchange (ASX), Investment & Sustainable Business Outlook, Article: 2, Issue:1, Volume: 1 pp. 21-121, https://accountingbusinesscare.com.au/investment-sustainable-business-outlook/ or https://accountingbusinesscare.com.au/mapping-exchange-traded-funds-etfs-asx/
Acknowledgement to Mahfuja Binte Malek, MBA Student, UBSS, for assisting in data analysis
Diversification is one of the key rationales for creating an investment portfolio. Exchange Traded Funds (ETFs), a subset of Exchange Traded Products (ETPs), are inherently diversified by design. Each ETF product is invested across a) different asset classes (such as stocks and bonds), b) different industry sectors, c) different companies of various market caps (large, mid, and small), and d) different geographical regions (domestic & international markets).
ETFs are fundamentally pools of funds that are professionally managed and track various indexes, including single-market, regional, global, and emerging-market indexes, and are invested in by retail investors, custodians, superannuation funds, companies, and financial advisors. Investors can buy or sell ETFs on the stock exchange, like shares and bonds, during trading hours.
ETFs were introduced first in the USA and Canadian financial markets in 1993, and the SPDR S&P 500 ETF (SPY) was the 1st ETF product in the global financial market.
Exchange-traded funds can be of two main types:
ETFs were introduced first in the Australian Securities Exchange (ASX) on 27th August 2001. Since then, the ETF market has experienced a 187 times growth between August 2001 and January 2025. SPDR S&P/ASX 50 Fund (SFY AU) and SPDR S&P/ASX 200 Fund (STW AU) were the first two ETFs listed at the Australian Securities Exchange (ASX).
In January 2025, the Australian Securities Exchange had 373 listed ETFs across 19 clusters, totalling approximately AUD 249 billion in market value. During the same period in January 2024, ASX had 319 listed ETFs across 18 clusters, valued at approximately AUD 174 billion. Hence, between January 2024 and 2025, there has been about 17% growth in the number of ETFs listed on the ASX, with approximately 43% growth in the market value of ETFs during the same period. In 2025, the Crypto Asset cluster was the newest addition.
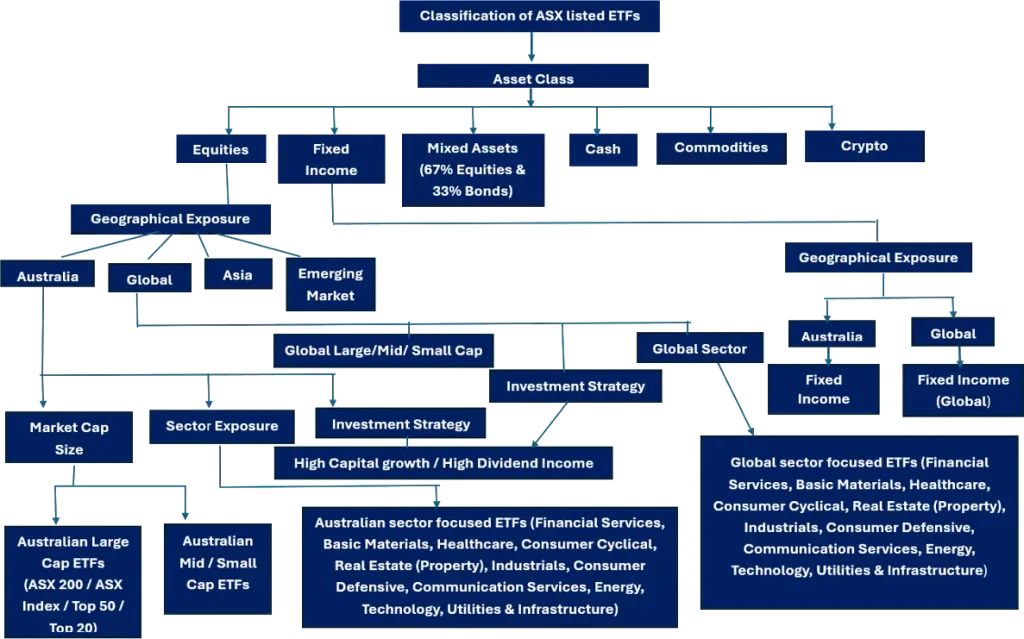
The Australian Securities Exchange (ASX)- listed ETFs are classified into five fundamental broad categories and nineteen clusters. The five fundamental classifications are:
a. Equities
b. Bonds [Fixed Income interest-bearing asset class]
c. Mixed Assets [ASX listed Mixed asset-based ETF portfolios with an investment composition of 67% in Equities and 33% in Bonds based on the asset class]
d. Cash
e. Commodities
f. Crypto
For example, an equity-based ETF is classified further into four geographic markets: Australia, Global, Asia, and Emerging Markets. In contrast, a fixed-income-based ETF is classified into two geographic markets: Australia and Global.
After geographical market-based classification, an equity-based ETF is classified further into three main categories: Market-value Cap size, Sector exposure, and investment strategy.
For example: An Australian or Global ETF categorized further based on a) portfolio exposure to Large Cap, Mid Cap, and Small Cap companies, b) the percentage of investment exposure in different sectors, c) the ETF portfolio’s investment objective: to invest in portfolio of companies with high capital growth or to invest in a portfolio of high dividend paying companies.
Among nineteen ETF clusters, the top five clusters have 68% of all ETFs (in term of number of ETFs) listed on ASX as of January 2025, and those are as follows:
In terms of market value, the top five clusters account for 78.37% of the total ETF market value as of January 2025, and those are as follows:
Between 2024 and 2025, the top 5 ETF clusters saw an average 20% increase in the number of ETF listings and a 53% increase in average capital inflows. Among all clusters, the Equity-Global Strategy cluster has seen the highest growth in the number of ETFs listed and capital inflows.
In the Australian ETF landscape, retail investors are the largest investor segment in terms of the number of investors. The segment accounts for about 75%, whereas custodians are the most significant segment in terms of assets under management (AMU).
The key features of ETFs are:
Generally, an investment in a stock or a bond provides a yearly distribution in the form of dividends or interest, as well as the opportunity for a capital gain. Similarly, ETFs offer both dividend and capital gains opportunities.
The overall historical distribution (dividend and interest) and total return in 2025 and 2024 of all ASX-listed ETFs have highlighted the following trends:
(Note: Total return means: Performance is calculated on a total return by taking the change in the fund’s market price, reinvesting all distributions during the period, and dividing by the starting market price.
Beta is a measure of a stock’s or asset’s price volatility relative to the overall market volatility. Beta value indicates an asset’s extent of non-diversifiable risk, or systematic risk, i.e., the risk that applies to the entire market and cannot be diversified away. A beta value of 1 means the riskiness or price volatility of a stock & asset correlates with the market. Beta value less < than 1 means riskiness or price volatility of a stock & asset is relatively less than the entire market. A beta value greater than 1 indicates that a stock & asset is riskier or more price volatile than the overall market. A negative beta value inversely correlates with market stocks or assets related to gold, which can be relatively uncorrelated with overall market volatility.)…READ MORE
© 2024 Accounting and Business Care.